Best AI Tools for Automated Server Monitoring
AI server monitoring tools help detect issues in real time, predict failures, and improve system performance. Explore the best tools, features, and use cases in this guide.
AI tools for automated server monitoring detect problems with high speed. It monitors CPU load and memory use and network traffic through its real-time monitoring system. Intelligent algorithms detect unusual patterns which they use to issue warnings that prevent system failures.
Teams utilize predictive models which analyze historical data to identify upcoming system failures. Root cause analysis reduces debugging time by decreasing it from several hours to just a few minutes. Its provide scalability for both cloud environments and on-premises installations while they enhance system availability and reduce operational expenses.
Benefits of AI in Server Monitoring
AI tools for automated server monitoring change the game for IT teams. They watch servers 24/7, detect threats early, and fix issues automatically.
- Reduce downtime
- Improve uptime
- Lower operational costs
- Enable faster debugging
- Provide predictive insights
No more late-night alerts or guesswork, AI keeps systems stable and efficient.
Quick Comparison Table of AI Tools for Automated Server Monitoring
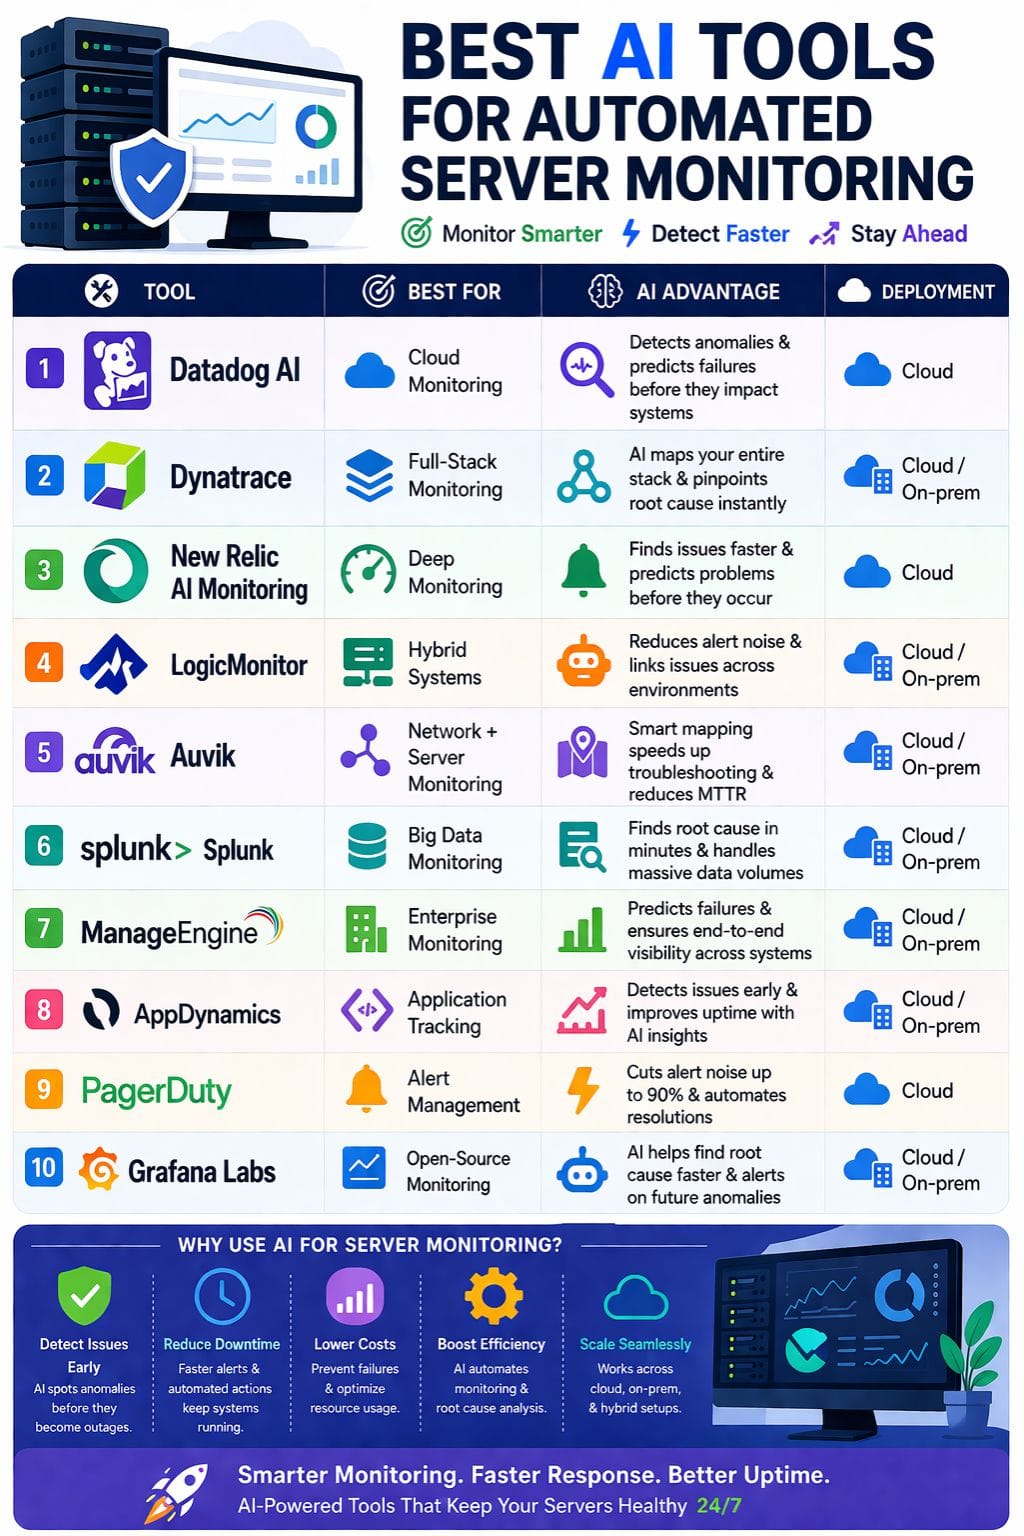
| Tool | Best For | Key Features | Pricing Level | Drawbacks |
|---|---|---|---|---|
| Datadog AI | Cloud monitoring | Watchdog AI, alerts, logs + traces | High | Expensive |
| Dynatrace | Full-stack monitoring | Auto discovery, AI insights | Medium–High | Learning curve |
| New Relic | Deep monitoring | Agent mapping, predictive alerts | High | Complex for small teams |
| LogicMonitor | Hybrid systems | Agentless monitoring, AI alerts | Medium | Costly |
| Auvik | Network + server | Real-time alerts, maps | Medium | Limited Linux support |
| Splunk | Big data monitoring | Logs, metrics, AI detection | High | Complex setup |
| ManageEngine | Enterprise monitoring | Auto discovery, predictive alerts | Medium | Setup time |
| AppDynamics | Application tracking | Flow maps, AI detection | High | Expensive |
| PagerDuty | Alert management | AI grouping, automation | Medium | Needs integrations |
| Grafana Labs | Open-source monitoring | Dashboards, AI assistant | Low–Medium | Needs setup |
Datadog AI
Datadog AI detects server problems with rapid speed through its machine learning capabilities. It monitors CPU and memory and network and application performance data throughout the entire day.
The Watchdog engine detects unusual behavior through its detection of high error rates and slow query performance. It connects logs and traces and alerts to enable fast problem resolution. It uses automatic baselining to create intelligent thresholds which adapt to your current traffic levels.
It provides predictive alerts which notify users about potential system crashes before those crashes occur. It extends its capacity to work with cloud platforms.
Pros
- Discovers unusual patterns which it identifies without requiring specific programming
- Establishes a single view which eliminates all visual clutter from the workspace
- Extends its operational capacity to handle extensive cloud computing requirements
Cons
- Experiences rapid cost increases, which result in high expenses
- Requires complex installation procedures which need to be performed in remote locations
Pricing
Request for pricing (RFP)
Dynatrace
The AI-based server monitoring system from Dynatrace provides superior performance compared to all other monitoring solutions. It automatically discovers hosts and virtual machines and container environments without needing any user configuration.
It monitors CPU and memory and network usage and process information through to their code details. The artificial intelligence system detects problems at an early stage while it creates system maps and identifies primary system faults.
It displays active user effects through its dashboard which shows current data. It uses predictive alerts to stop crashes from occurring by detecting potential failures beforehand.
Pros
- Detects issues before users can see them
- Requires no installation because the AI system manages all functions
- Reduces repair duration through its intelligent root cause identification system
Cons
- New users face difficulties because of learning curve
- Provides excessive functionality for basic server installations
Pricing
| Plan | Pricing |
|---|---|
| Foundation & Discovery | $7/host/month |
| Infrastructure Monitoring | $29/host/month |
| Full-Stack Monitoring | $58/host/month |
New Relic AI Monitoring
New Relic AI Monitoring enables quick and easy server tracking. It monitors CPU usage together with memory usage and network usage through continuous real-time observation. The AI system detects abnormal behavior patterns which it uses to send early alerts to teams.
It can forecast potential system failures before they occur. It creates a comprehensive map of all components from applications to cloud infrastructure. It uses alerts to enable immediate resolution of detected problems.
It shows all tool usage information together with associated latency times through its agent view functionality. The response traces verify system performance.
Pros
- Process of finding quick root causes leads to time savings that reach multiple hours
- Automatic installation process creates a faster installation experience
- The deep agent mapping system displays all connection points throughout the entire network
Cons
- New users face challenges because they need to overcome a steep learning curve
- Solution functions best with large stacks, whereas it does not work effectively with small stacks
Pricing
Request for pricing (RFP)

LogicMonitor
LogicMonitor is a smart tool for server monitoring. It finds servers on its own using IP scans, so you do not need agents. It tracks CPU, memory, disk, and network use in real time.
Its AI can spot strange patterns early. It sets flexible limits to reduce false alerts. This helps teams focus on real issues. It can link problems across cloud and on-prem systems and show the root cause fast.
It also gives early warnings before failures happen. Clear dashboards make data easy to read. It can even fix some issues on its own.
Pros
- Operates smoothly using both its standard and hybrid operational modes
- AI reduces false alerts through its precise detection capabilities
- Tracks requests from their origin to their final destination in a rapid manner
Cons
- Expensive price of the product prevents small teams from accessing it
- Organization has reduced its commitment to developing open-source software
Pricing
| Plan | Pricing |
|---|---|
| Essentials | $16/hybrid unit |
| Advanced | $27/hybrid unit |
| Signature + Edwin AI | $53/hybrid unit |
Auvik
Auvik improves server monitoring with clear, real-time views of CPU, memory, disk use, and uptime on Windows servers. It sends quick alerts when issues arise, so teams can act fast. Live network maps connect server data to the full network, making fixes easier.
Simple dashboards show easy charts, while preset alerts flag odd patterns early. Syslog data helps find root causes without delay. Teams reduce downtime with proactive checks and a single inventory view.
It works well in hybrid cloud setups, supports compliance needs, and helps service desks resolve issues faster with better visibility and control.
Pros
- The fast installation procedure displays all devices at their maximum speed
- Delivers alerts within three seconds of their occurrence
- Intelligent mapping technology reduces repair duration through its optimization capabilities
Cons
- Windows systems function better with this software because Linux support is weaker
- The base plan provides only basic AI capabilities because it excludes advanced AI features
Pricing
Request for pricing (RFP)
Splunk
Splunk is a strong AI tool for server monitoring. It tracks logs, metrics, traces, and events in real time. The AI finds odd patterns and cuts alert noise. It helps teams spot root causes fast. Its models can predict failures from trends in data. It can also fix some issues on its own, so teams avoid late-night calls.
Agentic AI links data across systems for quick debugging. Splunk works across cloud, hybrid, and on-site setups. It supports OpenTelemetry. Teams get a clear view of systems, improve uptime, and respond to problems much faster with less effort and risk overall.
Pros
- AI identifies the core issue which enables technicians to complete their repairs within a few hours
- Enables real-time detection of abnormal activities which prevents system failures
- Handles extremely large data volumes while maintaining operations
Cons
- Complex installation process.
- Requires adjustments to prevent it from generating incorrect alerts.
Pricing
Request for pricing (RFP)

ManageEngine
ManageEngine Applications Manager uses AI to watch servers, find issues fast, and fix problems before they harm service. It tracks CPU, memory, disk, and network use in real time.
Smart alerts flag odd patterns, predict faults from trends, and map app links for quick root-cause checks. Auto-discovery finds servers and services with no manual work.
Teams get clear graphs, reports, and mobile views to act fast. It scales for cloud, VMs, or on-site setups, cuts downtime, and boosts speed. It suits hybrid IT and gives end-to-end visibility across systems and apps. It also helps teams plan capacity and avoid overload.
Pros
- Deep AI insights cut fix times by providing root-cause maps
- It quickly determines servers, applications, and cloud gear
- Real-time alerts and graphs can also be viewed on your phone
Cons
- It requires time to set up large networks
- New users face a difficult learning process that requires extensive time to complete
Pricing
Request for pricing (RFP)
AppDynamics
AppDynamics offers AI-driven server monitoring with real-time tracking of CPU, memory, disk, and network use. It quickly detects unusual patterns, finds root causes, and sends smart alerts to reduce downtime. Auto-discovery links apps to servers for clear visibility.
Machine learning uses past data to predict issues early. It works across cloud, on-premise, and hybrid setups. Teams can see processes, containers, and Kubernetes in one place. Flow maps and transaction traces help fix problems fast.
This improves uptime and reduces mean time to repair, so systems stay stable and teams respond with speed and confidence.
Pros
- Generates real-time alerts that prevent false alarms
- Deep root cause analysis enables technicians to resolve issues that normally require several hours of work within a few minutes
- Provides quick deployment through its agents
Cons
- High cost hits small teams hard
- The user interface becomes slow during times of maximum system performance
Pricing
Request for pricing (RFP)
PagerDuty
PagerDuty is a strong AI tool for server monitoring. It collects alerts from tools like Datadog and LogicMonitor. It studies past incidents to find patterns. It can warn teams about risks like traffic spikes or slow response times.
It groups related alerts to cut noise by up to 90 percent. It can also run simple fixes, like restarting services. Teams get clear, real-time updates and faster triage. They can review events and improve over time.
This helps reduce downtime. It also frees staff to focus on key work, not constant alerts.
Pros
- AI grouping together with dependency maps enables better control over environmental noise
- Performs automated repairs through its ability to execute both system restarts and log file retrieval operations
- Provides real-time data access together with historical insights to help accelerate the triage process
Cons
- Requires external tools to measure its essential business performance
- The installation process for advanced system connections requires a difficult setup procedure
Pricing
| Plan | Pricing |
|---|---|
| Professional | $25/user/month |
| Business | $49/user/month |
| Enterprise | Custom Pricing |

Grafana Labs
Grafana Labs uses AI to watch servers and catch issues early. It tracks metrics, logs, and traces with smart agents. Tools like Grafana Assistant help find root causes, reduce alert noise, and warn about future faults. Dashboards show live data on CPU, memory, and network use.
The system can fix small problems on its own. It works well in cloud and on-site setups. Teams save time and keep systems running smoothly.
You can also use simple, natural language to search data and spot unusual patterns before they grow into bigger problems.
Pros
- Core open-source system reduces expenses while providing compatibility with every software stack
- The AI-based root cause analysis system enables repairs to be completed 50% faster
- The customized dashboards create clear data visualizations that all teams can understand
Cons
- Cloud services require additional payments to access complete AI capabilities
- Requires adjustment work to eliminate incorrect alert detection problems
Pricing
| Plan | Pricing |
|---|---|
| Pro | $19/month + usage |
| Enterprise | $25,000/year commitment |
How to Choose the Right AI Server Monitoring Tool
Choosing the right tool depends on your setup:
- Cloud-first teams: Datadog, Dynatrace
- Enterprise systems: Splunk, ManageEngine
- Budget-friendly: Grafana Labs
- Alert automation: PagerDuty
- Hybrid environments: LogicMonitor, Auvik
Consider:
- Infrastructure size
- Budget
- Ease of setup
- AI capabilities
Future of AI in Server Monitoring
AI tools for automated server monitoring change the game for IT teams. They watch every server round the clock, spot threats before they hit, and fix issues on their own.
No more late-night calls or guesswork, machines learn fast, predict failures, and keep uptime high. Downtime drops, costs fall, and teams focus on growth, not fires. In a world that never sleeps, these tools bring peace of mind.
They turn raw data into smart action, make chaos calm, and push businesses ahead with speed and strength. The future of servers is here: safe, smooth, and unstoppable.
FAQs
What are AI server monitoring tools?
AI server monitoring tools use artificial intelligence to track system performance, detect issues in real time, and predict failures before they happen.
Which AI tool is best for server monitoring?
Tools like Datadog, Dynatrace, and Splunk are among the best due to their advanced AI insights, real-time monitoring, and predictive capabilities.
How do AI monitoring tools reduce downtime?
They detect unusual patterns early, send alerts, and use predictive analytics to fix issues before they impact system performance.
Are AI server monitoring tools suitable for small businesses?
Yes, tools like Grafana Labs and LogicMonitor offer scalable solutions that can work for both small teams and large enterprises.