
UPI Hits Highest-Ever Monthly Volume: 24.51 Billion Transactions in August 2026
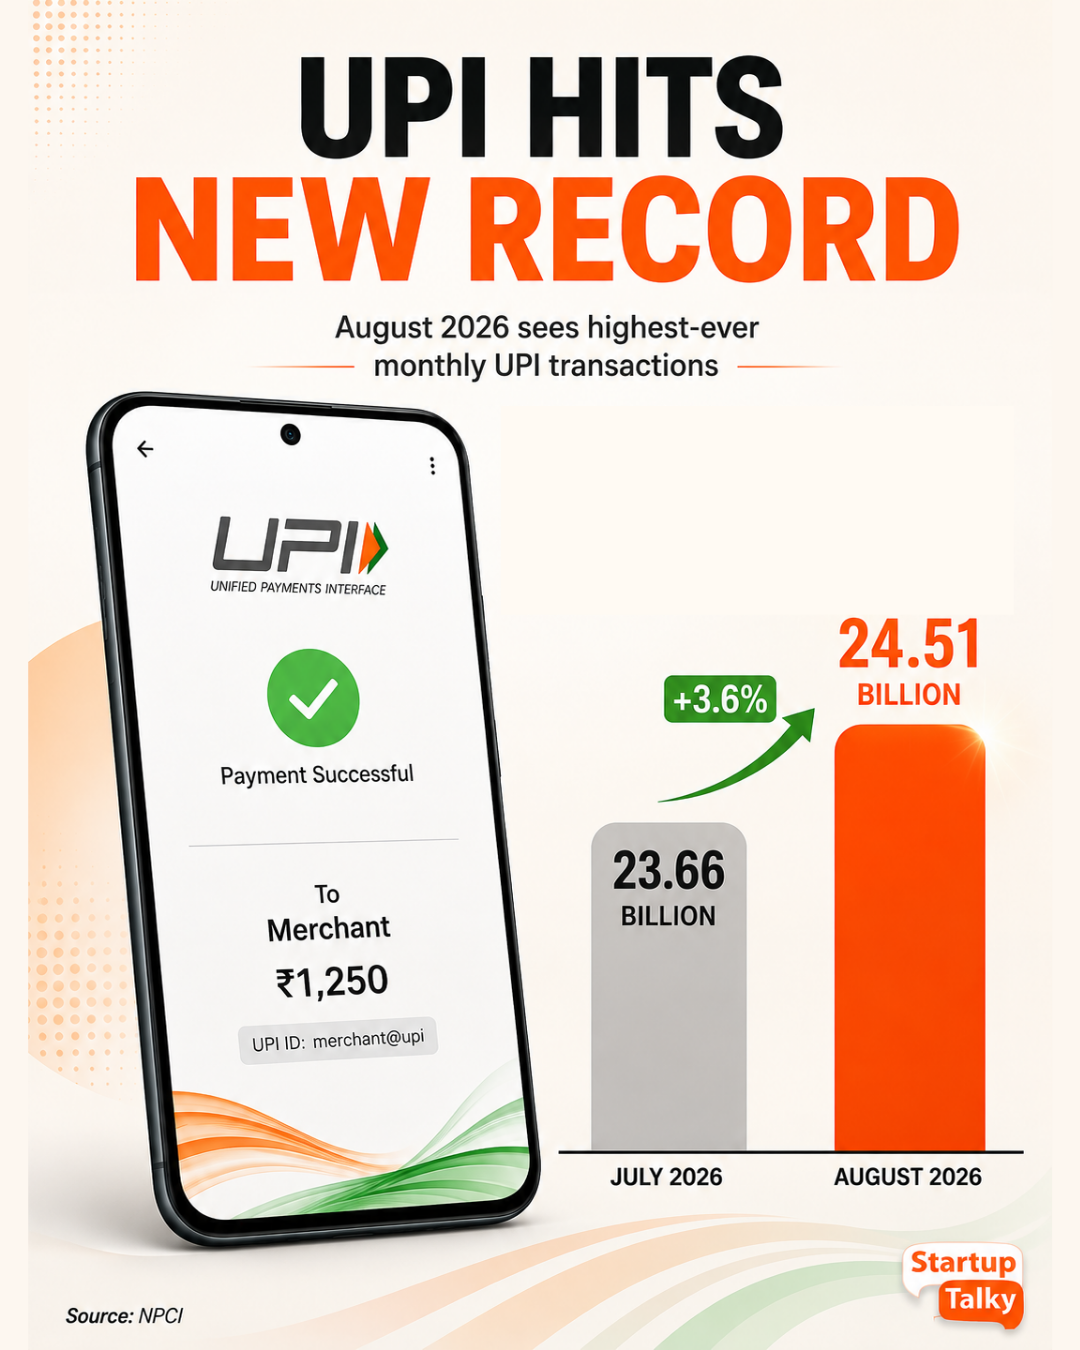
UPI processed 24.51 billion transactions worth Rs 29.82 lakh crore in August 2026, its highest-ever monthly volume, NPCI data shows.
India's Unified Payments Interface (UPI) has recorded its strongest month on record. According to data released by the National Payments Corporation of India (NPCI), the platform processed 24.51 billion transactions worth Rs 29.82 lakh crore in August 2026, its highest-ever monthly volume.
This is the second consecutive month UPI has set a new volume record, after surpassing the previous high of 23.66 billion transactions set in July. Transaction value, however, remained just below the all-time high of Rs 29.90 lakh crore recorded in May, suggesting August's growth came more from a higher number of transactions than from bigger-ticket payments.
Volume Growth Outpaces Value in August
Compared with July, transaction volume rose 3.6%, from 23.66 billion to 24.51 billion. Transaction value slipped 0.2% over the same period, easing marginally from Rs 29.88 lakh crore to Rs 29.82 lakh crore. This divergence, more transactions but a flat-to-lower total value, points to a continued fall in average ticket size rather than any pullback in UPI usage.
On a daily basis, UPI processed an average of 791 million transactions in August, up from 763 million in July. Average daily transaction value stood at Rs 96,205 crore, marginally lower than July's Rs 96,383 crore.
Month-on-Month and Year-on-Year Growth
| Metric | July 2026 | August 2026 | MoM Change | August 2025 | YoY Change |
|---|---|---|---|---|---|
| Transaction volume | 23.66 billion | 24.51 billion | +3.6% | 20.01 billion | +22% |
| Transaction value | Rs 29.88 lakh crore | Rs 29.82 lakh crore | -0.2% | Rs 24.85 lakh crore | +20% |
| Avg. daily volume | 763 million | 791 million | +3.7% | 645 million | +22.6% |
| Avg. daily value | Rs 96,383 crore | Rs 96,205 crore | -0.2% | Rs 80,177 crore | +20% |
Volume growth outpaced value growth on both a monthly and an annual basis. The gap reinforces the pattern seen through much of 2026: UPI is adding transactions faster than it is adding rupee value, a sign that smaller, everyday payments continue to make up a growing share of the platform's usage.
Growth Drivers: Industry Views
Executives in the payments ecosystem linked August's numbers to UPI's deepening use in everyday, low-value transactions. Kiwi co-founder and COO Siddharth Mehta said the platform's next phase of growth would be defined less by raw volumes and more by the broader financial experiences it enables for consumers.
NPST co-founder and CEO Deepak Chand Thakur pointed to falling ticket sizes alongside rising volumes as evidence that the growth is organic and widely distributed across the country, rather than concentrated in a few pockets.
These are industry perspectives shared with the press, not figures confirmed by NPCI.
PhonePe Leads, Google Pay Second as NPCI Awaits August App Data
NPCI is yet to release app-wise transaction data for August 2026. The most recent available breakdown is for July 2026:
| App | Transactions (July 2026) | Market Share |
|---|---|---|
| PhonePe | 10.86 billion | 45.89% |
| Google Pay | 7.65 billion | 32.33% |
| Paytm | 1.90 billion | 8.05% |
PhonePe retained its lead in the UPI ecosystem in July, followed by Google Pay and Paytm.
UPI's International Expansion
The Maldives launched a real-time payment corridor with India in August, extending UPI's global footprint. UPI merchant payments are now live in 10 international markets: Bhutan, Singapore, the United Arab Emirates, France, Mauritius, Sri Lanka, Nepal, Qatar, Cambodia and the Maldives. Greece remains connected for person-to-person transfers, while Singapore and Nepal also support remittance linkages.
State-Wise UPI Usage (Partial Data)
NPCI's most recent state-wise breakdown with published percentages is for April 2026 (released in May 2026); no later month's percentages were publicly available at the time of writing. This is a partial, top-three table, not a full all-state breakdown:
| State | Share of Transaction Volume | Share of Transaction Value |
|---|---|---|
| Maharashtra | 9.84% | 9.11% |
| Uttar Pradesh | 5.37% | 5.51% |
| Karnataka | 5.11% | 5.71% |
Maharashtra remained the largest contributor to UPI volumes and value in this data, with Mumbai Suburban its top-contributing district. Separate industry summaries citing more recent NPCI state releases (June 2026) list Maharashtra, Karnataka, Uttar Pradesh, Telangana and Tamil Nadu as the top five states by usage, but without percentage figures attached, so those are not included in the table above.
What the Numbers Suggest
August extends a pattern that has held through most of 2026: UPI keeps setting new volume records every month or two, even as year-on-year growth rates continue to moderate from the highs of 2025. Volume grew 22% year-on-year in August, against 34% in August 2025, a sign that the base effect is beginning to show even as the platform adds billions of transactions each month. Value has essentially plateaued in a narrow band just under Rs 30 lakh crore since May, while volume keeps climbing, a trend that fits the continued spread of smaller-ticket, high-frequency payments.
For merchants, fintechs and banks, the shift towards smaller, more frequent transactions is likely to keep shaping product and infrastructure decisions in the months ahead. With the festive season starting in September, spanning Navratri, Dussehra and Diwali, monthly volumes will be watched closely to see whether seasonal spending pushes transaction value back towards a fresh high.
 Muskaan Kapoor